

Data doesn’t drive anything. You drive. It’s not about data-driven decision making, it’s about decision-driven data analysis.
Yes, data matters. Full stop. But it is the supporting character not the main character in your decision process. How can you tell if the data you collect is good enough to inform a decision? You wouldn’t build a plane with faulty parts. Don’t make a decision with faulty data.
I’ve written before about how making smarter decisions comes down to how you set the stage. An inquisitive process that starts with framing the problem you’re seeking to address will help you win. It will conserve resources while lighting up each of your next steps. After defining your decision and its data needs, it’s time to collect, clean, and analyze it to uncover answers.
You do not need to go to math camp to engage with data
This is the stage where fierce interrogators thrive. And while we are dealing with numbers, it’s not about being a numbers expert. It’s about asking the right questions — about the data’s reliability, its context, and how it holds up under pressure.
The truth is, data can be distracting and disorienting, causing you to lose focus on the actual decision you’re trying to make. At the same time, it can easily be bent and misinterpreted to support our preconceived notions. A good QI interrogator makes sure the data is valid while keeping their eye on the ball, never losing sight of the business objective and only diving into it when it can affect the real decision at hand.
How to evaluate reliability and context
Decision-makers sometimes prefer to be precisely wrong than vaguely right. Let me explain. There’s often a temptation to prioritize clean-looking datasets simply for their accuracy of measurement, rather than messier—yet more reliable—information. That’s why it’s important to begin by inspecting exactly what data you’ve collected and drawing a straight line from it to your KPI.
WHAM!
No, not the English pop duo from the 1980s. When you make a decision, it’s important to interrogate the data to make sure it works in terms of Winning the Hearts And Minds (WHAM) of your audience or stakeholders.
Speaking of the 1980s, you’ve likely heard the case study of Coca-Cola’s attempt to introduce New Coke in 1985. Coca-Cola evaluated people’s preferences (logic, taste, what was in their minds) in a blind taste test setting without accounting for their real-world experiences (emotions, nostalgia, what was in their hearts). While people preferred the taste of New Coke, in the blind taste tests, they soundly rejected it in the marketplace. The lesson? People don’t wear blindfolds to the supermarket.
As a fierce data interrogator, you’ll want to ask: Am I looking at the right indicators? What am I not seeing? Don’t just assume what’s missing is similar to what you’ve already observed. Imagine, as Abraham Wald did, you had to design armor for B-52s coming back from bombing runs during World War II. The army’s engineers presented him with plans to reinforce the wings, tail, and widest areas of the plane’s body. But Wald saw that there was missing data—what about the planes that didn’t make it home? He urged them to focus on the cockpit, engines, and gas tanks instead. The planes that took fire in those critical areas were the ones that were tragically shot down. This phenomenon—called survival bias—arises when sampling is limited to people or things that have gone through a selection process. The fact that their very existence was filtered out of the dataset is the key to the most impactful insight.
Finally, don’t just assume that the data is inherently trustworthy. Numbers packed into a spreadsheet can give the appearance of authority, but you should always consider its source and their motivations. A start-up looking for seed money probably isn’t going to present data that shows a lack of profitability. It’s your responsibility as a decision-maker to assess a data source’s agenda and poke around for inconsistencies, outliers, and things that just fly in the face of common sense.
Hopefully, you have right data, and you can trust it. The next step is putting it in context. Data without context is dangerous. This bears repeating: Data without context is dangerous.
Analyze the following:
- What does the data mean for my business?
- How does it compare to historical data?
- How does it stack up against the competition, or other comparables?
Answering these three questions will help you avoid jumping to the wrong conclusions. Let’s say you own a local newspaper and the numbers show your profits dipped 5% from the previous year. Don’t press the panic button yet—you could end up making a decision that turns a negligible loss into a real business threat.
Instead, consider that 5% in the context of the company’s entire operation, its history, and its competitive landscape. Was the loss due to an investment in capabilities that could lead to heftier profits over the long term? Was it within the range of normal year-to-year fluctuations? And lastly, was it limited to your newspaper, or was it industry-wide? With the bigger picture in view, the loss might not be worth devoting precious resources to after all.
Applying the pressure
Your data is reliable. You’ve put it in context. Now it’s time to apply a little pressure to see if it stands up under stress. Here’s where the Pareto Principle comes in to save time without sacrificing precision.
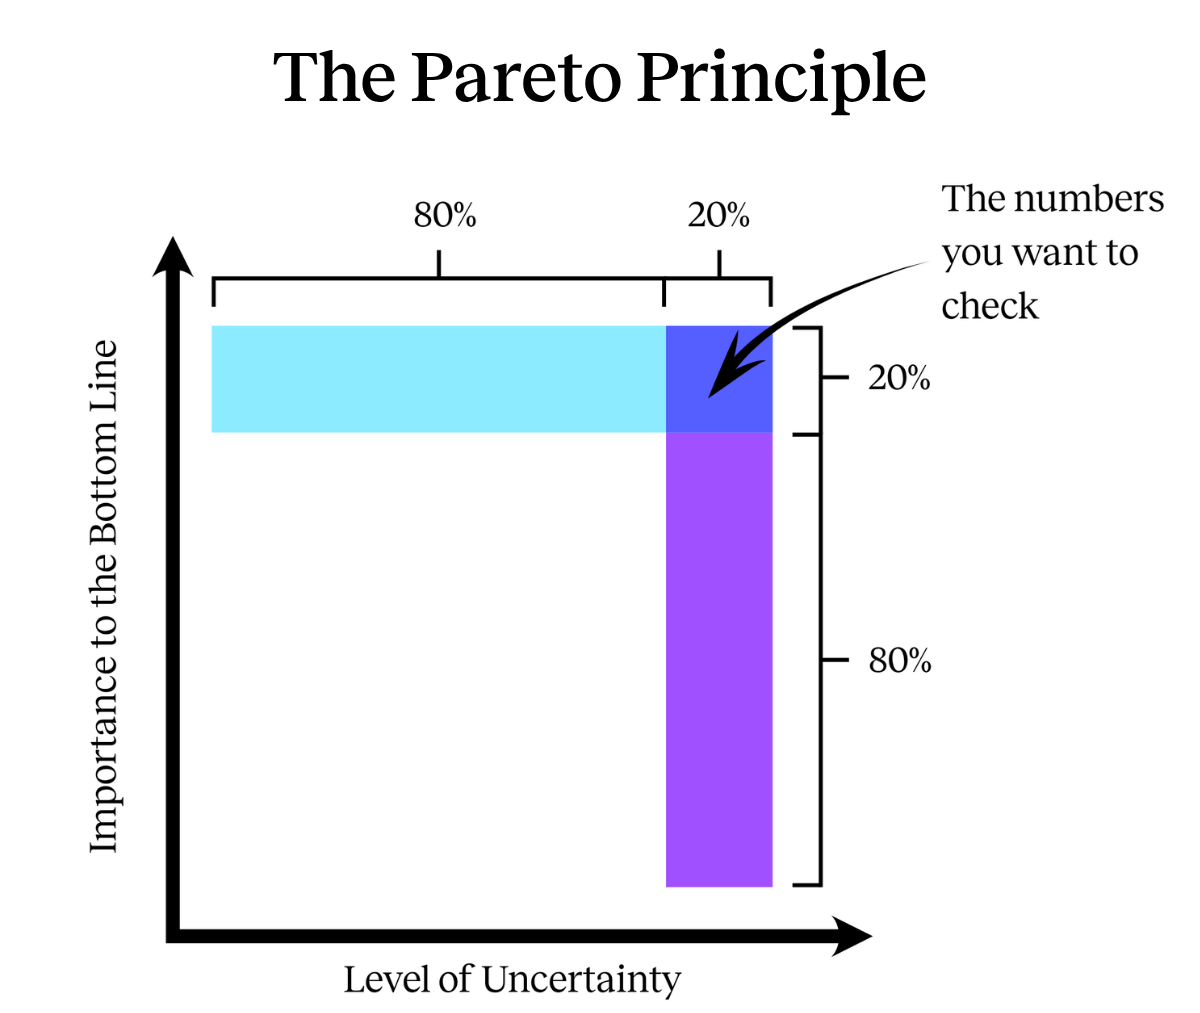
The Pareto Principle holds that 80% of the consequences come from 20% of the causes. With that in mind, you can narrow down the amount of data you need to test for reliability. But with large datasets, applying this principle can still be a daunting task. Save yourself time by ignoring low-impact numbers and focusing on the approximate fifth of the numbers in a spreadsheet that actually affect the bottom line. From there, dive deeper on the numbers that are both uncertain and important. Using the same principle, you can narrow your focus further to just 20% of that previously identified fifth. You’re left with a very manageable 4% of the dataset to scrutinize.
Another great way to pressure test is by bringing in team members with deep expertise outside your own. There’s a good chance they’ll catch something that’s not even on your radar. But in absence of help, your own intuition can be a powerful tool. You should have a good idea of what should occur when a number in a formula is set to 0, 1, or infinity. For example, when evaluating a spreadsheet with projections for next year’s profitability, try adjusting the number of units sold to 0. If that doesn’t cause profitability to nosedive, there’s clearly something off with the data.
Becoming a fierce QI interrogator
Effective decision-makers don’t memorize every granular piece of information in a spreadsheet. They don’t interrogate every number. But they do need to hold the data’s feet to the fire with focused, unrelenting inquiry that never untethers it from its context and business uses. The better decision makers ask about outliers. They ask for surprises in the data. They ask about missing data. They pressure test by going to the extremes by applying 0, 1, or 5x to a data point to test the logic. They put data in context.
That’s how you get data that’s decision-grade. After all, your data is only as good as the questions you ask of it.
Christopher Frank, CEO, PSB Insights